
AMFI-Registered Mutual fund Distributors
AMFI-Registered Mutual fund Distributors

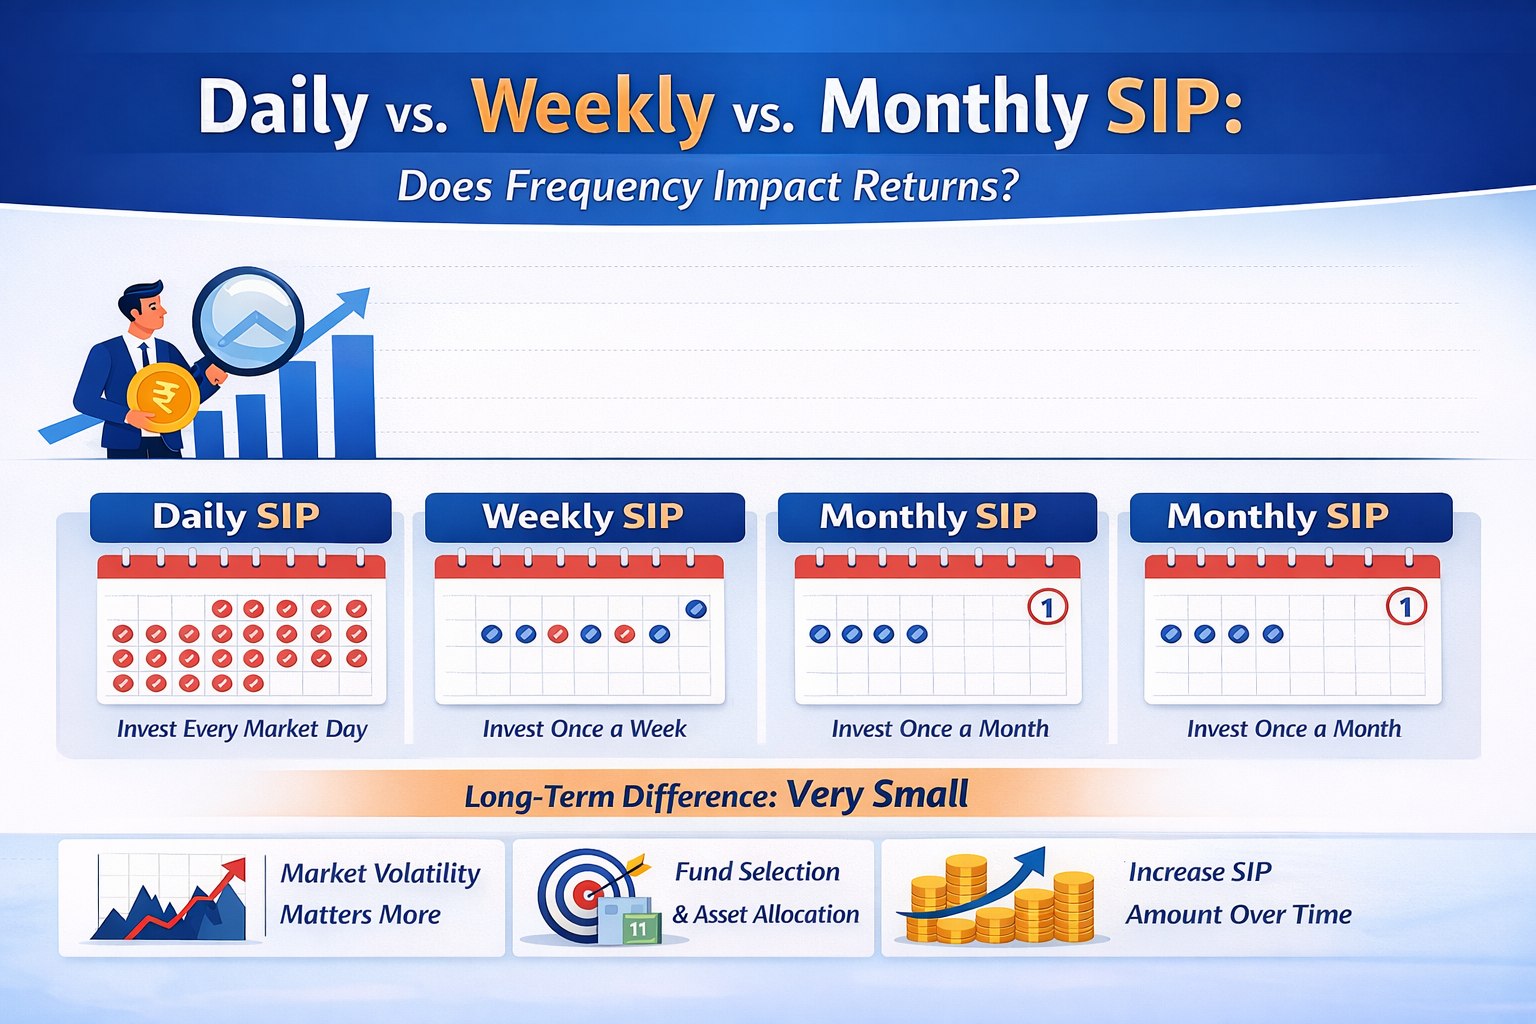
Systematic Investment Plans (SIPs) are one of the most popular ways to invest in mutual funds in India. They help investors build discipline and benefit from rupee cost averaging — buying more units when markets are low and fewer when markets rise. But when we choose how often to invest — daily, weekly, or monthly — does it actually change how much we earn? Let’s explore.
| Frequency | What it Does | Approx Investments/Year |
|---|---|---|
| Daily SIP | Invests every market day | 250 entries |
| Weekly SIP | One investment per week | 52 entries |
| Monthly SIP | One investment per month | 12 entries |
• Daily SIPs capture prices each trading day — in theory providing the finest cost averaging.
• Weekly SIPs sit in between daily and monthly.
• Monthly SIPs remain the default and most common choice for retail investors because they align with salary cycles.
Analyses of SIP returns over long periods — e.g., using NIFTY 50 TRI data from 2013–2023 — reveal that the difference in returns across frequencies is very small:
| Market Index / Frequency | Daily SIP CAGR | Weekly SIP CAGR | Monthly SIP CAGR |
|---|---|---|---|
| NIFTY 50 TRI | 12.44% | 12.45% | 12.44% |
| NIFTY Midcap 150 TRI | 16.35% | 16.36% | 16.32% |
| NIFTY Small cap 250 TRI | 13.31% | 13.32% | 13.29% |
(Apr 2013 – Apr 2023)
This shows the difference is often in hundredths of a percent and unlikely to matter much over long horizons.
| Fund | Monthly SIP XIRR | Weekly SIP XIRR | Daily SIP XIRR |
|---|---|---|---|
| Canara Robeco Emerging Equities Fund | ~16.90% | ~16.89% | ~16.90% |
| Parag Parikh Flexi Cap Fund | ~17.95% | ~17.95% | ~17.96% |
| SBI Contra Fund | ~16.83% | ~16.85% | ~16.88% |
(XIRR as of June 3, 2023)
Investment Period: 1 Jan 2014 – 31 Dec 2023 (10 Years)
Investment Amount: ₹10,000 per month equivalent
| SIP Frequency | Total Investment | Approx Value | XIRR (Illustrative) |
|---|---|---|---|
| Daily SIP | ₹12,00,000 | ₹22,35,000 | 13.05% |
| Weekly SIP | ₹12,00,000 | ₹22,32,000 | 13.02% |
| Monthly SIP | ₹12,00,000 | ₹22,28,000 | 12.98% |
🔎 Observation: The return difference across frequencies is marginal over long periods.
(Note: Figures above are for illustration purposes only and do not represent actual returns.)
🔹 Markets are random and volatile in the short term.
🔹 Over years and decades, ups and downs tend to average out.
🔹 This makes daily vs. weekly vs. monthly SIP returns practically similar in long horizons.
🔹 Historical studies show that even dates or timing of SIP investments don’t significantly move long-term performance.
📍 Most investing platforms and AMCs primarily support monthly SIPs — daily or weekly SIPs can be harder to set up automatically.
📍 Tracking and tax calculations become more complex with hundreds of entries in daily SIPs versus just 12 with monthly.
📍 More frequent debits require careful cash flow management — not ideal for most retail investors.
🎯 1. Start Early & Stay Invested – Time in the market beats timing the market.
📊 2. Choose the Right Funds – Performance consistency and fit with your goals matter far more.
📈 3. Increase SIP Amount Over Time – Annual step-ups can make a big difference in the final corpus.
🪙 4. Maintain Asset Allocation – Equity proportion based on risk tolerance typically impacts returns more than frequency.
✔ Daily SIP may theoretically smooth out prices slightly better — but in real long-term scenarios the return difference vs monthly SIP is negligible.
✔ Weekly SIPs occasionally show marginal edge, but it isn’t consistent.
✔ Monthly SIP remains the most practical, easiest, and widely adopted method for most investors.
Welcome to COGNITY WEALTH, a one-stop destination for comprehensive and dependable financial solutions. In a world where financial decisions shape life’s most important milestones, we aim to make those decisions easier, smarter, and more rewarding.

221 , Second Floor , Sebiz Infotech Private Limited , Sector 67 , Mohali Pincode - 160062


  |